Uses the clumped isotope temperature calibration of the form: $$y = a \times 10^6 / T^2 + b$$
temperature_axis(slope = 0.0449, intercept = 0.167)Details
Defaults to Bonifacie et al. 2017 $$\Delta_47 = (0.0449 \pm 0.001 \times 10^6) / T^2 + (0.167 \pm 0.01)$$
See also
temperature_calculation()
revcal()
tempcal()
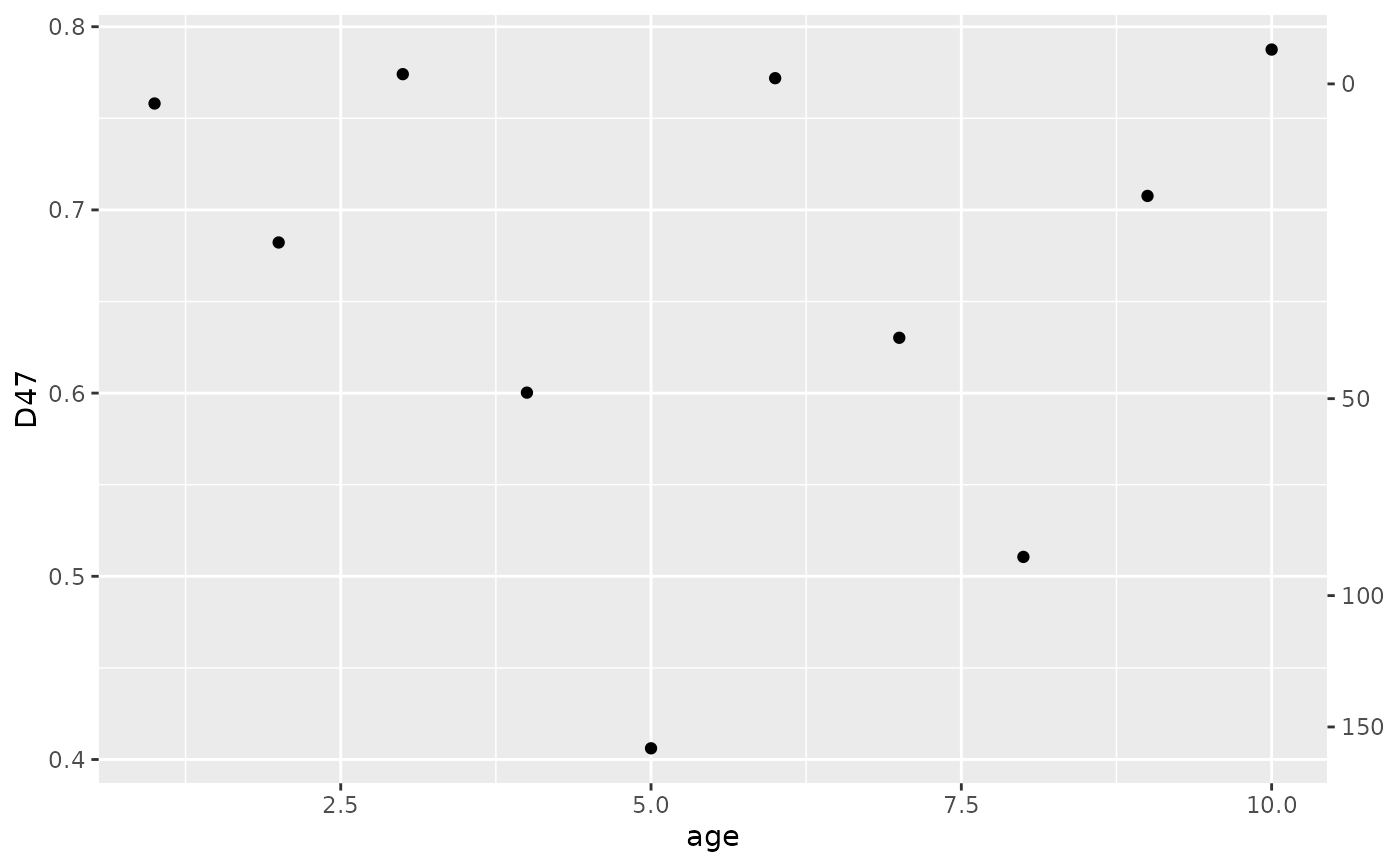
Examples
dat <- tibble::tibble(age = 1:10, D47 = rnorm(10, 0.7, .1))
# create an empty plot
ggplot2::ggplot(dat, ggplot2::aes(x = age, y = D47)) +
  ggplot2::geom_point() +
  # generate the formula for temperature on the fly
  ggplot2::scale_y_continuous(sec.axis = ggplot2::sec_axis(temperature_axis()))